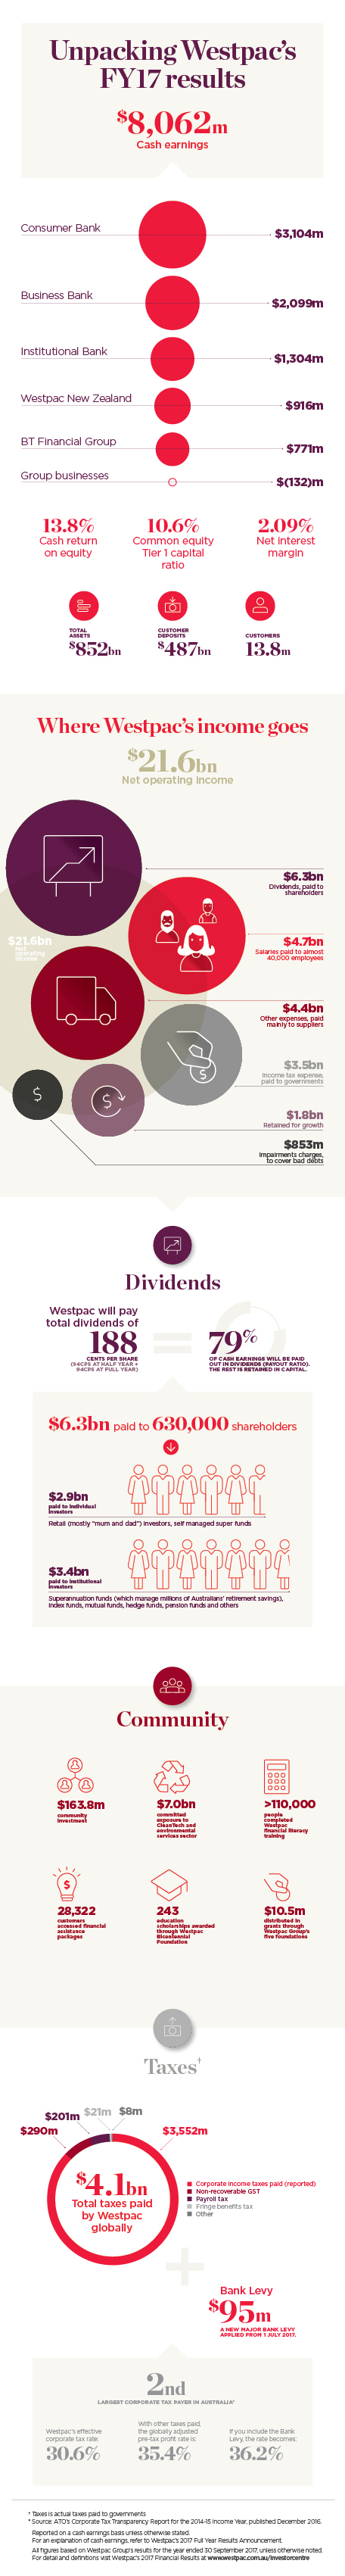
Emma Foster is a freelance writer. Previously, she led Westpac Wire and was a key contributor until December 2022. Prior to joining Westpac in 2013, she spent almost 20 years in corporate affairs and investor relations, primarily in large financial services and consultancy firms, in Australia, UK and Europe. She is also a photographer and podcaster.
{"topicSelector":[{"tagId":"newsroom:topics/economy","name":"economy","description":"Explore more Economy insights at Westpac Wire. Subscribe to the Westpac Wire newsletter to stay in the know.","title":"Economy","url":"/news/topic.economy/"},{"tagId":"newsroom:topics/banking","name":"banking","description":"Explore more Banking insights at Westpac Wire. Subscribe to the Westpac Wire newsletter to stay in the know.","title":"Banking","url":"/news/topic.banking/"},{"tagId":"newsroom:topics/digital","name":"digital","description":"Explore more Digital insights at Westpac Wire. Subscribe to the Westpac Wire newsletter to stay in the know.","title":"Digital","url":"/news/topic.digital/"},{"tagId":"newsroom:topics/diversity","name":"diversity","description":"Explore more Diversity insights at Westpac Wire. Subscribe to the Westpac Wire newsletter to stay in the know.","title":"Diversity","url":"/news/topic.diversity/"},{"tagId":"newsroom:topics/community","name":"community","description":"Explore more community insights at Westpac Wire. Subscribe to the Westpac Wire newsletter to stay in the know.","title":"Community","url":"/news/topic.community/"},{"tagId":"newsroom:topics/workplace","name":"workplace","description":"Explore more workplace insights at Westpac Wire. Subscribe to the Westpac Wire newsletter to stay in the know.","title":"Workplace","url":"/news/topic.workplace/"},{"tagId":"newsroom:topics/sustainability","name":"sustainability","description":"Explore more sustainability insights at Westpac Wire. Subscribe to the Westpac Wire newsletter to stay in the know.","title":"Sustainability","url":"/news/topic.sustainability/"},{"tagId":"newsroom:topics/technology","name":"technology","description":"Explore more Technology insights at Westpac Wire. Subscribe to the Westpac Wire newsletter to stay in the know.","title":"Technology","url":"/news/topic.technology/"},{"tagId":"newsroom:topics/property","name":"property","description":"Explore more Property insights at Westpac Wire. Subscribe to the Westpac Wire newsletter to stay in the know.","title":"Property","url":"/news/topic.property/"},{"tagId":"newsroom:topics/westpac","name":"westpac","description":"Stories featuring Westpac corporate news.","title":"Westpac","url":"/news/topic.westpac/"},{"tagId":"newsroom:topics/sme","name":"sme","description":"Explore more Small Medium Enterprise insights at Westpac Wire. Subscribe to the Westpac Wire newsletter to stay in the know.","title":"SME","url":"/news/topic.sme/"},{"tagId":"newsroom:topics/innovators","name":"innovators","description":"Explore more Innovators insights at Westpac Wire. Subscribe to the Westpac Wire newsletter to stay in the know.","title":"Innovators","url":"/news/topic.innovators/"},{"tagId":"newsroom:topics/leadership","name":"leadership","description":"Explore more Leadership insights at Westpac Wire. Subscribe to the Westpac Wire newsletter to stay in the know.","title":"Leadership","url":"/news/topic.leadership/"},{"tagId":"newsroom:topics/covid19","name":"covid19","description":"Stories influenced by the COVID-19 pandemic.","title":"COVID-19","url":"/news/topic.covid19/"},{"tagId":"newsroom:topics/investing","name":"investing","description":"Explore more Innovators insights at Westpac Wire. Subscribe to the Westpac Wire newsletter to stay in the know.","title":"Investing","url":"/news/topic.investing/"},{"tagId":"newsroom:topics/startups","name":"startups","description":"Explore more Startups insights at Westpac Wire. Subscribe to the Westpac Wire newsletter to stay in the know.","title":"Startups","url":"/news/topic.startups/"},{"tagId":"newsroom:topics/personalfinance","name":"personalfinance","description":"Explore more insights about personal finance, financial literacy and financial wellbeing. ","title":"Personal finance","url":"/news/topic.personalfinance/"},{"tagId":"newsroom:topics/agribusiness","name":"agribusiness","description":"Explore more Agribusiness insights at Westpac Wire. Subscribe to the Westpac Wire newsletter to stay in the know.","title":"Agribusiness","url":"/news/topic.agribusiness/"},{"tagId":"newsroom:topics/scams","name":"scams","description":"Stories about the latest cyber scams news and trends. ","title":"Scams","url":"/news/topic.scams/"},{"tagId":"newsroom:topics/billsbites","name":"billsbites","description":"Explore more insights from Bill Evans at Westpac Wire. Subscribe to the Westpac Wire newsletter to stay in the know.","title":"Bill\u0027s Bites","url":"/news/topic.billsbites/"},{"tagId":"newsroom:topics/data","name":"data","description":"Explore more data insights at Westpac Wire.","title":"Data","url":"/news/topic.data/"},{"tagId":"newsroom:topics/environment","name":"environment","description":"Explore more Environment insights at Westpac Wire. Subscribe to the Westpac Wire newsletter to stay in the know.","title":"Environment","url":"/news/topic.environment/"},{"tagId":"newsroom:topics/payments","name":"payments","description":"Explore more Payments insights at Westpac Wire. Subscribe to the Westpac Wire newsletter to stay in the know.","title":"Payments","url":"/news/topic.payments/"},{"tagId":"newsroom:topics/fintech","name":"fintech","description":"Explore more Fintech insights at Westpac Wire. Subscribe to the Westpac Wire newsletter to stay in the know.","title":"Fintech","url":"/news/topic.fintech/"},{"tagId":"newsroom:topics/politics","name":"politics","description":"Explore more Politics insights at Westpac Wire. Subscribe to the Westpac Wire newsletter to stay in the know.","title":"Politics","url":"/news/topic.politics/"},{"tagId":"newsroom:topics/career","name":"career","description":"Stories providing career insights, tips and trends.","title":"Career","url":"/news/topic.career/"},{"tagId":"newsroom:topics/social-enterprise","name":"social-enterprise","description":"Stories relevant to or featuring social enterprises.","title":"Social enterprise","url":"/news/topic.social-enterprise/"},{"tagId":"newsroom:topics/indigenous","name":"indigenous","description":"Explore more indigenous insights at Westpac Wire. Subscribe to the Westpac Wire newsletter to stay in the know.","title":"Indigenous","url":"/news/topic.indigenous/"},{"tagId":"newsroom:topics/regulation","name":"regulation","description":"Explore more Regulation insights at Westpac Wire. Subscribe to the Westpac Wire newsletter to stay in the know.","title":"Regulation","url":"/news/topic.regulation/"},{"tagId":"newsroom:topics/wellbeing","name":"wellbeing","description":"Stories featuring wellbeing trends, insights and stories.","title":"Wellbeing","url":"/news/topic.wellbeing/"},{"tagId":"newsroom:topics/superannuation","name":"superannuation","description":"Explore more Superannuation insights at Westpac Wire. Subscribe to the Westpac Wire newsletter to stay in the know.","title":"Superannuation","url":"/news/topic.superannuation/"},{"tagId":"newsroom:topics/westpac-scholars","name":"westpac-scholars","description":"Stories featuring Westpac Scholars. ","title":"Westpac Scholars","url":"/news/topic.westpac-scholars/"},{"tagId":"newsroom:topics/reinventure","name":"reinventure","description":"Explore more Reinventure insights at Westpac Wire. Subscribe to the Westpac Wire newsletter to stay in the know.","title":"Reinventure","url":"/news/topic.reinventure/"},{"tagId":"newsroom:topics/asia","name":"asia","description":"Explore more Asia insights at Westpac Wire. Subscribe to the Westpac Wire newsletter to stay in the know.","title":"Asia","url":"/news/topic.asia/"},{"tagId":"newsroom:topics/podcast","name":"podcast","description":"Explore Westpac Wire\u0027s podcast series.","title":"Podcast","url":"/news/topic.podcast/"},{"tagId":"newsroom:topics/history","name":"history","description":"Stories unearthed from Westpac\u0027s private archival collection. ","title":"History","url":"/news/topic.history/"},{"tagId":"newsroom:topics/businesses-of-tomorrow","name":"businesses-of-tomorrow","description":"Stories featuring Westpac Businesses of Tomorrow program winners. ","title":"Westpac Businesses of Tomorrow","url":"/news/topic.businesses-of-tomorrow/"},{"tagId":"newsroom:topics/tax","name":"tax","description":"Explore more tax insights at Westpac Wire. Subscribe to the Westpac Wire newsletter to stay in the know.","title":"Tax","url":"/news/topic.tax/"},{"tagId":"newsroom:topics/goodpair","name":"goodpair","description":"Explore more Good Pair stories, showing two people making a big difference together. ","title":"Good Pair","url":"/news/topic.goodpair/"},{"tagId":"newsroom:topics/currencies","name":"currencies","description":"Stories providing currencies insights, tips and trends.","title":"Currencies","url":"/news/topic.currencies/"},{"tagId":"newsroom:topics/deals","name":"deals","description":"Explore more Deals insights at Westpac Wire. Subscribe to the Westpac Wire newsletter to stay in the know.","title":"Deals","url":"/news/topic.deals/"},{"tagId":"newsroom:topics/veterans","name":"veterans","description":"Explore more insights about defence force veterans at Westpac Wire.","title":"Veterans","url":"/news/topic.veterans/"},{"tagId":"newsroom:topics/analysis","name":"analysis","description":"Expert analysis on economic news and other trends.","title":"Analysis","url":"/news/topic.analysis/"},{"tagId":"newsroom:topics/IWD","name":"IWD","description":"Stories focusing on International Women\u0027s Day, on 8 March annually. ","title":"IWD ","url":"/news/topic.IWD/"},{"tagId":"newsroom:topics/rework","name":"rework","description":"Stories of businesses pivoting in the face of the COVID-19 pandemic.","title":"Rework","url":"/news/topic.rework/"},{"tagId":"newsroom:topics/10Qs","name":"10Qs","description":"\"10Qs with...\" is a series that asks leaders what makes them tick.","title":"10Qs","url":"/news/topic.10Qs/"},{"tagId":"newsroom:topics/commodities","name":"commodities","description":"Insights into commodities markets.","title":"Commodities","url":"/news/topic.commodities/"},{"tagId":"newsroom:topics/quarterlife","name":"quarterlife","description":"Explore more Quarter Life insights at Westpac Wire. Subscribe to the Westpac Wire newsletter to stay in the know.","title":"Quarter Life","url":"/news/topic.quarterlife/"},{"tagId":"newsroom:topics/shareholders","name":"shareholders","description":"Stories relevant to Westpac shareholders.","title":"Shareholders","url":"/news/topic.shareholders/"},{"tagId":"newsroom:topics/climate","name":"climate","description":"Explore more climate insights at Westpac Wire. Subscribe to the Westpac Wire newsletter to stay in the know.","title":"Climate ","url":"/news/topic.climate/"},{"tagId":"newsroom:topics/esg","name":"esg","description":"Explore more insights on environmental, social and governance issues at Westpac Wire. Subscribe to the Westpac Wire newsletter to stay in the know.","title":"ESG","url":"/news/topic.esg/"},{"tagId":"newsroom:topics/boardwalk","name":"boardwalk","description":"A series of in-depth podcast interviews with board directors to find out what\u0027s on their minds. ","title":"Board Walk","url":"/news/topic.boardwalk/"}]}