Is housing faring better through 2021 lockdowns?

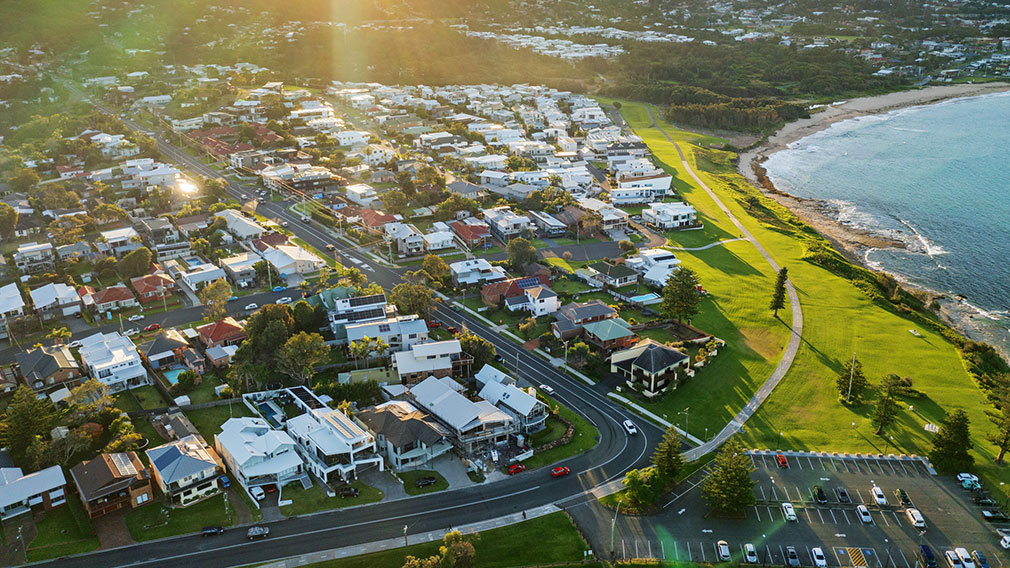
For the week ending August 29, around 1350 new properties came onto the market across Sydney despite the lockdown. (Getty)
The Australian property market has produced some remarkable trends in the past 16 months.
Even in the midst of renewed and extended lockdowns, some indicators suggest the housing market has been even more resilient in 2021, compared to 2020.
With this in mind, it’s important to note not all pockets of the housing market remain robust.
By analysing a few key metrics, we’re able to better understand how markets are responding to lockdown constraints in 2021, compared to 2020.
Consumer confidence is the first indicator that reflects buyer, and seller, sentiment. We know through early 2020, when Australia was first plunged into lockdown, consumer sentiment declined over six weeks, from peak-to-trough, 40.1 per cent. A second decline, which coincided with Melbourne’s rising case numbers and renewed lockdowns, fell 11.3 per cent over seven weeks.
The current lockdown has so far seen consumer sentiment fall 12.3 per cent over seven weeks.
The conclusion?
.png)
It is likely the shock of lockdowns means the decline in consumer sentiment has become ‘shallower’ as the market is armed with more knowledge about the economic impact of lockdowns, and importantly, witnessed a strong recovery following the lift of restrictions last year.
In 2020, stage two restrictions coincided with a drop in sales volumes through April of 33.9 per cent. In Sydney, sales fell 36.7 per cent and 40.3 per cent across Melbourne. Restrictions made it harder for the real estate industry to conduct business, consumer confidence had plummeted and 600,000 jobs were lost in the same month.
Fast forward 16 months and social distancing measures have largely been reduced nationally, households still have higher than average savings, and a record low cash rate of 0.1 per cent has meant the average cost of debt has continued to decline.
So far, Sydney’s employment levels have experienced only a mild decline, falling 0.9 per cent across NSW in July 2021, compared to 5.9 per cent in April 2020.
Against this economic backdrop, sales volumes during this lockdown have fallen, but not as dramatically as last year. CoreLogic figures estimate Sydney’s sales volumes fell 3.7 per cent in July, and a further 18 per cent in August.
The longer lockdowns are extended, the further sales volumes may fall.
We also haven’t seen dramatic drops in the amount of newly advertised stock through 2021.
For the week ending August 29, around 1350 new properties came onto the market across Sydney. The figure remains 23 per cent below the five-year average based on pre-COVID figures, but we’ve seen new listing figures starting to climb.
If new listings continue to rise, the total decline since the start of Sydney’s 2021 lockdown period will be 37.5 per cent, compared to the 52.4 per cent fall recorded during the early 2020 restrictions.
It’s a slightly different situation in Melbourne where new listings have fallen more dramatically since the lockdown began in August this year. The city in general has experienced more volatility, simply because lockdowns have been more frequent. Having said that, the average weekly number of new listings in Melbourne (1765) is higher than Sydney (1577) and remain higher than the average weekly figures recorded for the whole of 2020 (1345).
Finally, clearance rates have remained strong in Sydney at 80.2 per cent in the week ending August 29 and 35.9 per cent in Melbourne. However, average clearance rates vary significantly throughout Sydney’s various local government areas and have declined most significantly across the Central Coast and ‘LGAs of concern’ such as in the South West, Parramatta and the Outer West and Blue Mountains since June.
A final observation on COVID-19’s restrictions on our housing markets is that lockdowns won’t affect confidence and housing market decisions in a uniform way.
Westpac chief economist Bill Evans discusses the economic outlook and his latest forecasts.
Sydney and Melbourne’s large and diverse populations means households and workers are impacted in a variety of ways.
We know from Matthew J Beck and David A Hensher’s recently published study on remote work conditions that about a third of Australia’s employed workforce were not in the office in the second half of 2020.
For certain professions, such as financial and insurance services, IT, science and communications and anyone in the rental, hiring and real estate industry, they were able to continue working from home, uninterrupted, five days a week.
The same can’t be said for those in the food or accommodation business, which unfortunately meant they were far more likely to have lost work through each lockdown period.
Detailed ABS labour force data for the 12 months to May shows how many employed Sydneysiders were in industries that were more likely to work from home.
As an example, for employed people living in North Sydney and Hornsby – located 50km northwest of Sydney’s CBD – almost 40 per cent were in these industries, with less chance of disruption to their income.
It’s these kinds of figures that help us to understand how important geographical differences are on the performance of Australia’s various housing markets during such unusual times.
The views expressed are those of the author and do not necessarily reflect those of the Westpac Group.
The information in this article is general information only, it does not constitute any recommendation or advice; it has been prepared without taking into account your personal objectives, financial situation or needs and you should consider its appropriateness with regard to these factors before acting on it. Any taxation position described is a general statement and should only be used as a guide. It does not constitute tax advice and is based on current tax laws and our interpretation. Your individual situation may differ and you should seek independent professional tax advice. You should also consider obtaining personalised advice from a professional financial adviser before making any financial decisions in relation to the matters discussed.


