Where jobs are being created – and culled


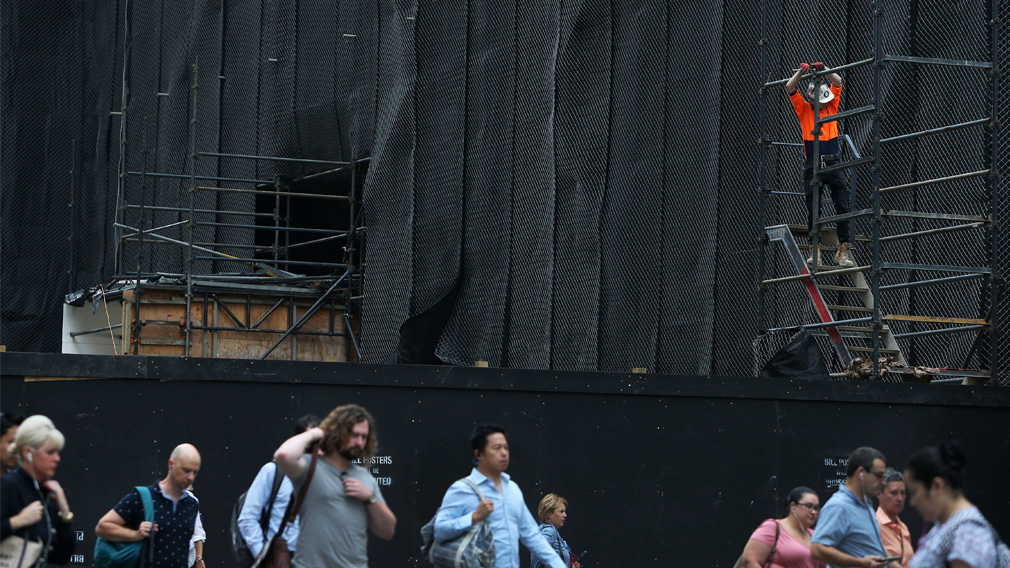
Construction's share of total employment hit 9.5 per cent by February 2018, a record high, but jobs have declined since as other industries pick up the slack. (Getty)
There’s a lot of focus on the “tension” between why jobs growth has been strong but GDP data weak. However, is the labour market “puzzle” that opaque?
Exploring the latest quarterly breakdown of employment by industry for the year to February, it’s clear non-cyclical jobs (dominated by government) are booming, up 5.6 per cent on a six-month annualised take of the past two quarters. In contrast, cyclical sectors, such as construction and retail, are slowing markedly, contracting 0.4 per cent over the same period, and are falling as a proportion of total employment.
Since February 2008, the “non-cyclical” group has increased as a proportion of total employment from 27.9 per cent to 31.9 per cent while cyclical jobs have fallen more than 5 percentage points to 59.4 per cent.
Trends in the construction industry, an important driver of employment in recent years, are telling.
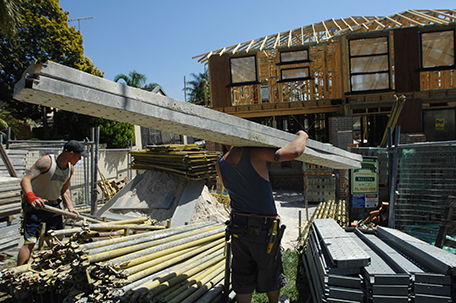
Construction employment fell 49,200 in the year to February 2019 as the property market cooled. (Getty)
On the back of the Sydney and Melbourne-led property price boom, the construction industry job gains peaked at 103,800, or 9.8 per cent, in the year to November 2017. For context, this represented a 0.9 percentage point contribution to the 3.3 per cent annual pace in total jobs growth as construction's share of total employment headed to 9.5 per cent by February 2018, a record high for this Australian Bureau of Statistics data series dating back to 1984.
Since then, construction employment has fallen 49,200 in the year to February 2019 as the property market cools, representing a drag of minus 0.4 percentage points on total employment growth (which printed at 2.3 per cent annually).
This is unlikely a surprise for anyone working in the residential construction space but holds broader implications for the economy.
The last time construction employment dragged meaningfully on employment growth was back in 2012. But given construction's share of total employment is now larger than it was in 2012, there’s the potential to for a larger drag on employment should the construction downturn continue to deepen and broaden out of NSW and WA.
At a time when GDP growth is slowing, slower employment in the construction industry will be an important factor for the outlook for the jobs market and wages overall, and thus for the Reserve Bank.
Already, the flow-on impacts are clear when looking at the breakdown of the construction sub-sectors.
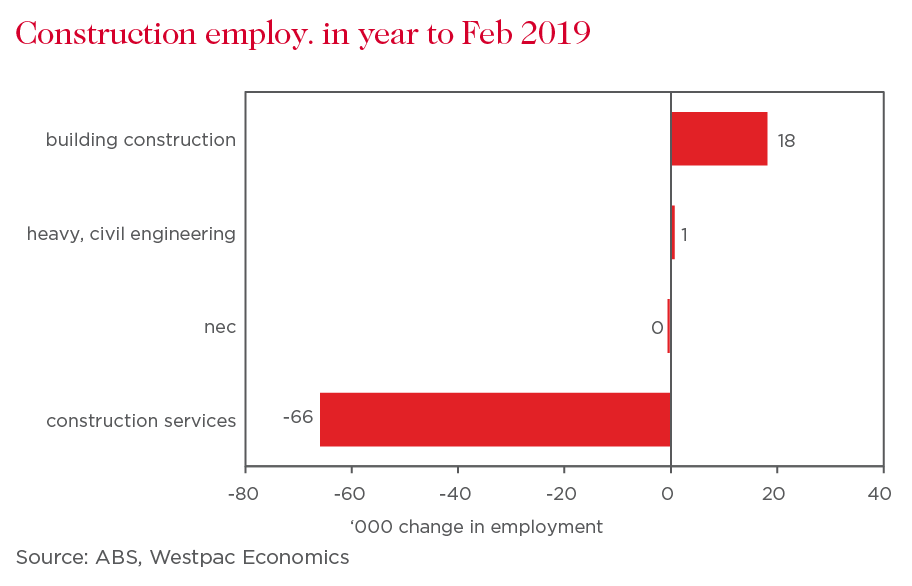
In the year to February, all of the decline in employment in construction can be explained by the 66,000 decline in construction services – land development & site preparation services, building structure services, building installation services, building completion services and other construction services (which we suspect includes construction contractors) – which are often involved with project and site preparation before construction activity starts.
Given the softening market, it is likely to be some time before construction services find a base to grow from.
Also, the impact of construction activity on employment is broader than direct construction employment. Westpac has long compiled an aggregate of sectors in manufacturing that would have a strong linkage with construction – wood products, non-metallic minerals, metal products and furniture – which represent a bit more than 30 per cent of manufacturing employment.
Employment in these sectors had been in a trend decline since the late 1990s, like most manufacturing. During the downtrend there have been some short-run up cycles but these sectors grew 30,000 since late 2016 – the first sustained uptrend in employment in almost two decades – that boosted manufacturing employment linked to construction activity to levels not seen since 2007.
In fact, manufacturing employment relating to metal products has even been stronger than during the mining investment boom, indicative of just how significant the recent lift in construction activity has been for broader employment gains.
However, with public construction activity likely to peak in 2020, steel manufacturing employment is likely to become a drag on the overall jobs market going forward.
So with the construction sector struggling, where have all the jobs been generated in recent times?
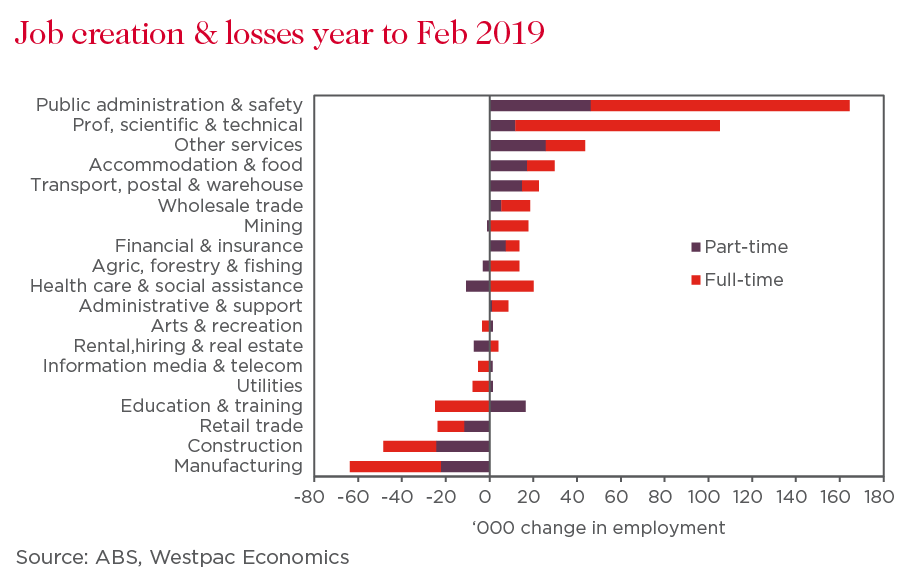
Interestingly, white collar employment explained just about all the 282,000 growth in employment in the year to February, based on our definition of people working in finance, real estate and hiring services, professional, scientific and technical services, other business services and government services.
It marked a handover from the household services (accommodation & food services, education & training, health care & social assistance and arts & recreation) industries, which have been the powerhouse of employment growth for some time.
While business services (information, media and telecommunications, finance and insurance services, rental, hiring and real estate, professional, scientific and technical and administrative support services) employment growth accelerated to 5.2 per cent in the year, the big surge came from the 23.5 per cent lift in government employment contributing more than half of overall employment growth.
The state data highlights where the big swings have occurred.
In NSW where property prices have fallen hardest, employment gains were driven by leisure and hospitality and white collar jobs, while education and health, plus construction jobs, were the main drags. Victoria’s strong jobs market was driven by education and health plus white collar jobs, weighed by accommodation & food services, manufacturing and retail trade employment. Victorian’s construction employment held up a bit better than NSW.
For Queensland, just about all of the gains in employment can be put down to household services and, in particular, government employment or sectors funded by governments. Fellow mining-dominant state Western Australia was powered by retail and wholesale, white collar and improved employment conditions in the mining industry.
With the Reserve Bank indicating the unemployment rate and inflation will be key to its monetary policy decisions, how the next few months play out for jobs across big sectors like construction will be critical to watch. And while there’s likely to be some assistance from heavy, civil engineering as public works projects continue, it’s looking like the downturn in dwelling construction activity is going to weigh on building construction employment through 2019.
Combined with this week’s soft inflation print, we think the RBA remains on track to cut the cash rate in August.
This material contains general commentary, and market colour. This material does not constitute investment advice. This information has been prepared without taking account of your objectives, financial situation or needs. We recommend that you seek your own independent legal or financial advice before proceeding with any investment decision. Whilst every effort has been taken to ensure that the assumptions on which the forecasts are based are reasonable, the forecasts may be affected by incorrect assumptions or by known or unknown risks and uncertainties. The ultimate outcomes may differ substantially from these forecasts. Except where contrary to law, Westpac and its related entities intend by this notice to exclude liability for this information.