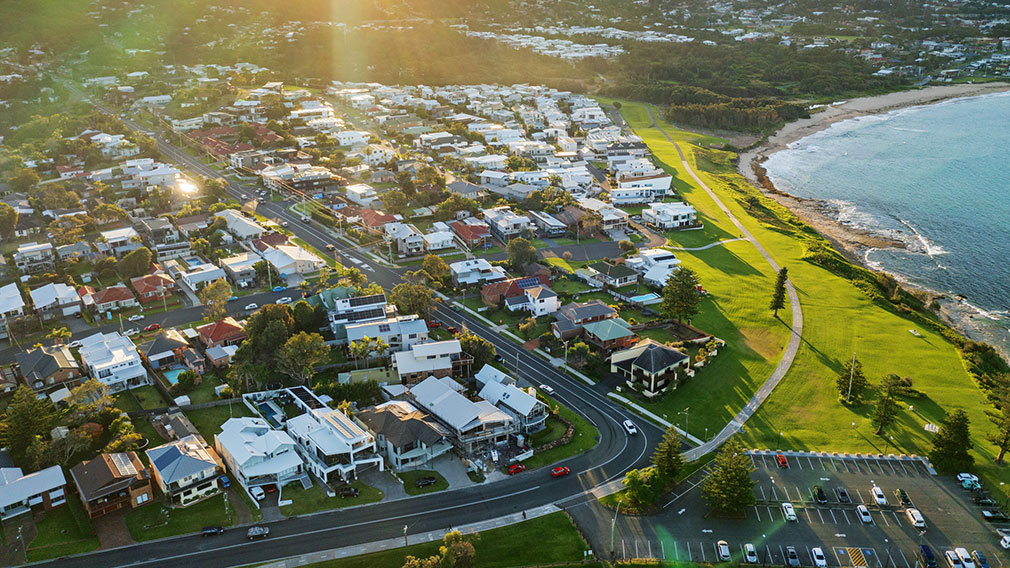
Taking stock of property sales pullback


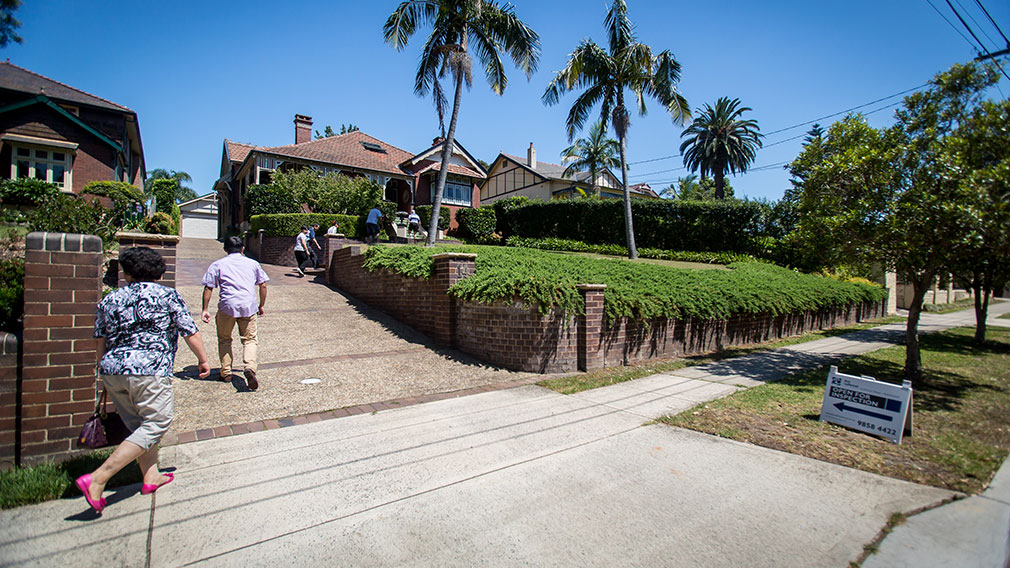
New property listings are running at just under 37,000 a month, below the historical average. (Getty)
If you’re on the hunt for property, you’ve probably noticed a drying up of listings in recent months.
Whether a first homebuyer, investor or just an owner keeping an eye on happenings in the neighbourhood, there’s an undeniable urge to regularly check out the latest listings. Like everything in property in Australia, it depends a bit on where you are: in some markets, such as suburbs in Perth, the problem is less to do with a dearth of new listings than a large backlog of unsold properties, while trends also differ for houses and apartments.
Nationally, new listings are running at just under 37,000 a month, below the historical average of 40,000, as more sellers shy away from testing thin markets and aren’t “forced” by circumstance to do so.
That’s not surprising with dwelling prices mostly falling, and unemployment and interest rates – while rising -- remaining low.
Yet there’s more to the story.
As our recent Housing Pulse research showed, two listings metrics – the ratio of sales to new listings and total listings expressed as months of sales – suggest the market has weakened to levels not seen in seven years. For example, the sales to new listings ratio is sitting in the 0.90-0.92 range, meaning that sales are only absorbing about 90 per cent of the new listings each month. That is below the 10-year average of 1.02, although still above previous cycle lows in 2011 (0.77) and 2008 (0.74).
But while the national picture is one of a moderate overhang of unsold property accumulating at a moderate pace, in both cases it isn’t the absolute number of listings driving this – it’s actually weak sales, which have fallen to a 28-year low.
Add in this month’s Corelogic data revealing the 11th consecutive month of decline in national dwelling values and tighter credit conditions, and the odds of new listings and sales trends improving in the near term appears low.
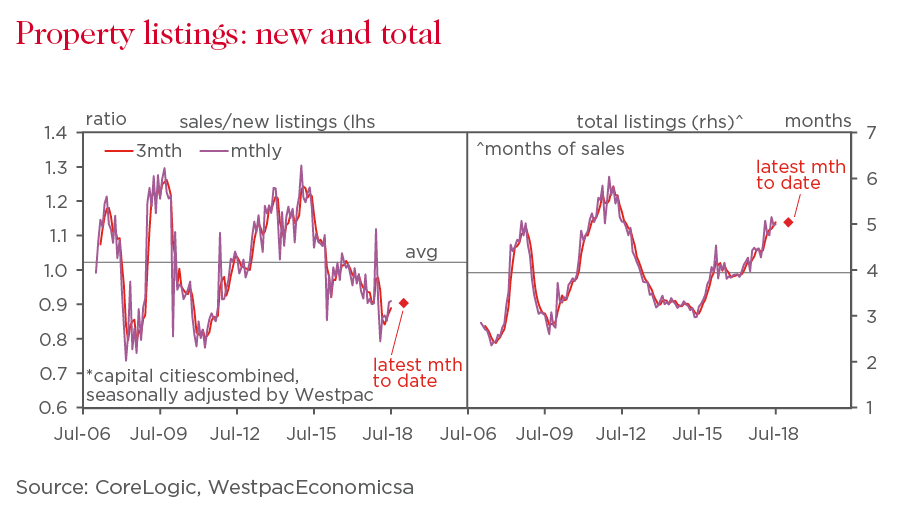
If we look at total national listings – rather than new – they’ve risen 11 per cent in the past year to just under 105,000, above the average of 96,000 but below the peak of 131,000 in 2011, just prior to the Reserve Bank’s interest rate cutting cycle that began in November 2011 and supported the property market. The difference this time is that the RBA has clearly set a high bar to further cuts in the cash rate, which is already at a record low 1.5 per cent, so stimulus from monetary policy appears unlikely.
Already, the decline in turnover is increasing supply in “months of sales” terms. If current trends continue, it would take vendors nearly five months to clear unsold dwelling stock, above the historical average of four months. Again, things have been worse – it’s below the 2012 peak of six months.
Still, it’s clearly a buyer’s market.
If we dig deeper by houses and units, a very interesting contrast is unfolding. For houses, both new and total listings are running close to long run averages relative to sales, i.e. supply and demand look relatively well balanced.
For units, however, new listings have been outstripping sales for about two and a half years now and total listings have risen well above average relative to sales – current listings would take over six months to clear at the current pace of sales.
While both measures reflect the sharper drop-off in turnover across this market, they highlight a clear risk of a more substantial overhang of stock emerging if new listings were to rise from here. That’s notable given the surge in high rise building that could result in more units coming onto the market in coming years.
By city, there’s a similar pattern across the main eastern capitals.
Despite differing conditions and variations in physical supply and demand profiles, Sydney, Melbourne and Brisbane are all showing a moderate overhang of stock accumulating at a moderate pace, the trends a little softer in the two biggest cities. In Sydney, where prices are down 5.6 per cent in the past year, sales have declined sharply.
Brisbane and Perth both have higher total listings in terms of months of sales, the latter sitting at 7.8 months, near historic highs. More broadly, the WA Consumer Housing Sentiment index has fallen back again since May and the prolonged housing market correction looks set to carry well into its fifth year.
With last week’s national accounts revealing a further decline in the household savings ratio, the state of the housing market is becoming even more critical to the outlook for consumption and the overall economy.
Our previous Housing Pulse report in May observed that the market looked susceptible to a renewed weakening: while not dire, three months on, with activity not stabilising, risks remain pitched to the downside.
This material contains general commentary, and market colour. This material does not constitute investment advice. This information has been prepared without taking account of your objectives, financial situation or needs. We recommend that you seek your own independent legal or financial advice before proceeding with any investment decision. Whilst every effort has been taken to ensure that the assumptions on which the forecasts are based are reasonable, the forecasts may be affected by incorrect assumptions or by known or unknown risks and uncertainties. The ultimate outcomes may differ substantially from these forecasts. Except where contrary to law, Westpac and its related entities intend by this notice to exclude liability for this information.